Live Trading Signals

CAFEMarket structure engine BETALive crypto signals

Crypto ATR Fractal Engine by Cryptanov measures how far price usually travels after a phase change and shows where the market has an edge. Every signal is recorded in real time before the outcome — a forward test, not a backtest. Access from $9.99 per month.

Free access to the CAFE group: 92 of 100 places left — then subscription $9.99/month
***Active
LONG
Entry0.000000
Opened00.00.0000 00:00
Unlock All 30+ Coins
XRPUSDT Closed
LONG
Entry1.043600
Exit1.068000
Opened10.11.2026 18:39
Closed10.11.2026 21:35
+2.34%
***Closed
LONG
Entry0.000000
Opened00.00.0000 00:00
Unlock All 30+ Coins
***Closed
LONG
Entry0.000000
Opened00.00.0000 00:00
Unlock All 30+ Coins
***Closed
LONG
Entry0.000000
Opened00.00.0000 00:00
Unlock All 30+ Coins
***Closed
LONG
Entry0.000000
Opened00.00.0000 00:00
Unlock All 30+ Coins

VIP / Premium Signals

All coins and scales, market-regime filter and strategy map.

500+Signals with outcomes
5Years of historical testing
34+Coins + the whole market
Demonstration data slices

Strategies D, D1, D2, D3 — what they show

D stands for Dynamic — dynamic entries. These four are not trading strategies. They are demonstration slices of the forward test: each shows how the same entry points behave with a different exit and risk logic. They can be used, but we do not recommend trading them as they are — and if you do, longs only.

Why we keep them public: they show honestly what happens with different exits on the same data. The working logic is described below.

Shorts — honestly

We measured shorts on all the same data. Most shorts do not work after fees. Only a narrow selection works — roughly 15% of what longs give — and only with our own rules, which we do not publish.

We also tried the opposite: inverting losing shorts into long trend trades. Before fees there is a small edge, after fees — about zero: the losses of shorts come from rare extreme moves that a mirrored trade cannot capture.

Trend strategies — honestly

In every trend test we ran — 90 variants of moving averages and channel breakouts on 5 years, plus trend versions on the whole market — the yearly drawdown is large and none of the variants is positive in every year.

Why: strong trends are rare and look the same at entry as thousands of ordinary moves that reverse. On the way to a level price reverses more often than it continues — the very property CAFE measures. A trend system pays fees on many false starts and lives on a few big moves, so between them it drags through long losing streaks.

Key tool

Trend filter: it forbids, it does not point

The trend filter watches the whole market and switches on a ban: when the market is in a one-sided move, it forbids entries against it. It does not show where to enter and is not a trend signal.

Important: do not try to trade "with the trend" by the filter. Above we showed why trend trading gives large drawdowns. The filter only removes the most dangerous entries from the CAFE data.

The filter state is published for subscribers in Telegram: when longs are forbidden, when shorts are forbidden, when both are allowed.

What we recommend

Deep zones, the long slice and the trend filter

This is not a "long system". CAFE measures the market skew — and on our data the skew works for longs on deep pullbacks. That is exactly what the long slices of the statistics show.

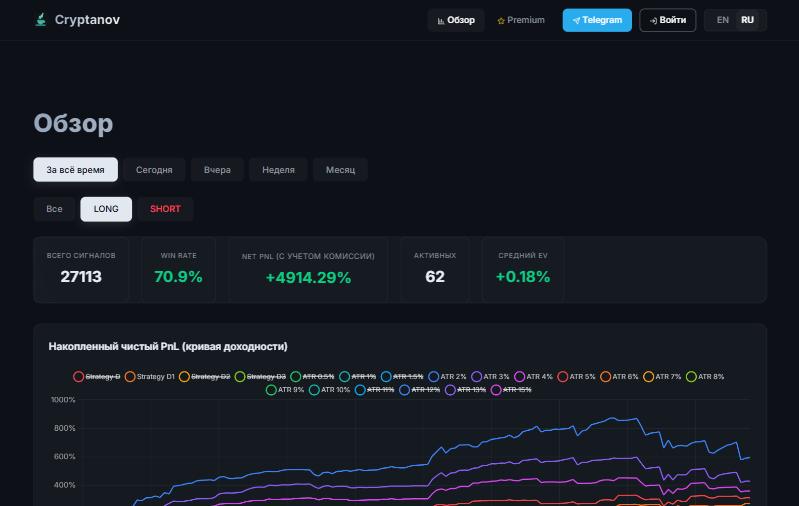
  1. Open the overview or statistics and switch the filter to LONG — this is the long slice of the forward test.
  2. Look at levels 4–8%: the deeper the level, the higher the expected value after fees. Levels 0.5–2% are negative after fees.
  3. Enter only when the trend filter does not forbid longs (state in Telegram for subscribers).
  4. Limit risk in advance: isolated margin, a stop on every position, no averaging down.
  5. Open the long slice
Overview page with the LONG filter enabled
Overview → LONG: the long slice of all strategies and levels of the forward test.

Build your own strategy

The data lets you assemble an approach for yourself: choose coins, entry levels, how many coins to trade in parallel and what share of the deposit to give each position.

Fractals differ: on the small ones (27m, 50m) trades are short, and losses do not drag on for long in any case; on the large ones (2h, 4h) moves are bigger but take longer. Combining them gives an even more flexible strategy.

You make all decisions on your own account yourself. The site provides measurement data and statistics, not investment advice; past results do not guarantee future ones.

Our trading bot

Unibot — CAFE rules on 34 coins

Unibot is our own executor: the CAFE engine plus a set of our own rules for entry, position size and protection, on 34 liquid coins. It is the only rule set tested on 5 years of history with costs measured against the live exchange account.

+152%annual portfolio return on deposit, average (model, 5 years, stake 1/450)
+105%annual portfolio return in the worst year
−14%max portfolio drawdown (from deposit peak, open positions included)

This is modelling of the past with real costs, not a promise. Since 24.10.2026 the current version runs without manual changes; the details are in the technical passport.

Faster, but riskier

CAFE screener — the whole market

The same engine on all liquid Binance futures — about 120 coins, without Unibot's 34. More signals and faster turnover, but small coins are riskier: sharp delistings, thin order books, manipulation. So the screener trades with a half stake and extra protections.

  • Forward test since 20.10.2026: ≈ +0.4% per trade after fees
  • Live trading with a half stake since 29.10.2026
  • Unlike Unibot: the whole market instead of 34 coins, more trades, higher risk; the history is still short
Live trading now

Deep 50m — a ladder of deep pullbacks, no leverage

The simplest CAFE scheme: we buy only deep pullbacks on the 50-minute fractal — from 4% and deeper, adding to the coin step by step (up to 4 entries: 4 → 7 → 10 → 13%, larger the deeper it is). The base stake is 1/34 of the deposit; all positions together never exceed the deposit — no leverage and no stop. Protection is a ladder too: when the market starts falling, shallow levels pause first; the deep ones keep working until a real crash.

+42%average year — model (backtest on 5 years of history, after fees)
+28%worst year of five
−14%max drawdown of the account (with open positions)
  • Forward test 25.05–29.10.2026: +18% with a drawdown of −3%
  • No leverage: one coin takes at most ~25% of the deposit (all 4 entries), all positions together — at most the deposit
  • Crash days still hurt: the worst month in 5 years cost the scheme about −6%

The model figures are a backtest: they show how these rules would have worked in the past. That is why we also test them forward: the forward test of 25.05–29.10.2026 gave +18%. The model is reconciled with the forward test trade by trade.

Bot connection and access to the rules

On the top plan the bot can be connected to your own account — an exclusive service, discussed individually.

Access to the Unibot and screener rules is possible on request for those who really pay for the bot's work and want to connect it themselves. These are our own rules and our edge, so access is only by personal agreement.

Discuss in Telegram

Absolute Transparency. No Look-Ahead Bias.

Most systems curve-fit past data. We play by strict rules: every signal is published beforehand and cannot be faked.

Zero Look-Ahead Bias

The algorithm cannot see the future. It trades blindly strictly on current mathematical realities.

No Curve-Fitting

We don't over-optimize for past performance. The math works dynamically in any market phase.

100% Verifiable

Every signal is logged before execution. You can audit its performance in real-time on the blockchain.

No Backtesting Magic

This is NOT a Backtest — It's a Forward Test!

Cryptanov is a full forward simulation (forward test) with complete verification of every signal. All data is collected in real-time on the live market, with no curve-fitting to historical data.

Typical Backtest

  • Analyzes past data with full hindsight
  • Results are curve-fit to look perfect
  • No way to verify — just trust the screenshot
  • Often breaks in live trading

Looks great on paper. Falls apart in reality.

LIVE

Cryptanov Forward Test

  • Bot places a LONG or SHORT signal in real-time
  • Signal is logged and timestamped before outcome
  • Market confirms: profit or loss — no editing
  • Every result is publicly verifiable

All results are from a real-time forward test

How It Actually Works

Algorithm detects pattern
Bot opens LONG/SHORT
Market moves
Result confirmed
Every signal is a forward test: the system cannot see the future. Results are confirmed by the market, not fitted to history.
Patience is your ultimate tool

Waiting for the Best Entry Point

The system patiently waits for the best entry point instead of jumping into a trade at current prices like most novice traders do.

The truth is, if you wait just a couple of candles, you almost always get a better price than if you entered in a hurry. This is one of the main secrets of the strategy.

We prefer the "rare but accurate" approach. The main goal is not the number of trades, but achieving a high average Expected Value (EV > 1). There is no need to rush.

Rule #1: Protect your deposit

Sideways Bounce and Trend Anomalies

In 70-80% of cases, the price moves in a range and bounces off the level. But there are also strong non-pullback trends — anomalies that can wipe out a month's worth of profit.

This is normal market mechanics: first, it feeds you and lets you earn, and then it takes everything away at once and even liquidates your deposit. By trying to wait out an anomaly, you lose everything.

That is why risk must be limited in advance: a stop on every position, isolated margin, no averaging down and no adding margin to a losing trade.

The main idea is not how to earn, but how not to lose what you have already earned. To do this, you can use our tables with smart filters for valid coins, or apply a "bad days" filter. The platform provides raw data — it is the trader's job to build their own strategy.

From Thousands of Hypotheses to One Working Strategy

A system born from rigorous testing and real losses.

My name is Alex. I have been doing algorithmic trading for three years. Along the way there were hundreds of strategies, several websites and thousands of tests — and most ideas broke against reality: either the algorithm hid look-ahead bias, or over the long run the result slid to 50/50 and exchange fees slowly ate the deposit.

The market is full of scammers trading "on intuition" and passing off wishful thinking as reality. My goal was to find a true mathematical edge—a statistically valid strategy that works transparently on large datasets.

In spring 2026 CAFE — Crypto ATR Fractal Engine — grew out of that experience. Since 25 May 2026 every signal has been recorded in a real-time forward test; the engine has been tested on 5 years of history and trades a live account. I do not guess — I test, and I show the results, losses included.

Self-Learning Entry Points

Our system continuously analyzes each coin's behavior and calculates optimal entry and stop-loss levels in real-time.

View Live Levels

Levels update automatically — no static values

VIP / Premium Signals

All coins and scales, market-regime filter and strategy map.

92 spots remaining

Subscribe to Telegram Channel

The Illusion of Fast Money

Why trying to turn $100 into $150 in a day leads to liquidation, and how the system solves it

The Problem of Unrealistic Expectations

Even strong funds consider 15–30% a year an excellent result. Yet traders with a $100 deposit want to make $50 in a day. This forces them into massive leverage and high risks, mathematically guaranteeing a blown account.

Loss Mechanics & Black Swans

We naturally risk more than we earn. Taking 10x leverage on $100 creates a $1,000 position. Earning 10% means the price must move 10%, which is rare. A single "black swan" can wipe out a month of gains—this is just market mechanics.

The Strategy D1 Solution

Strategy D1 is designed to offset these inevitable losses through a high Expected Value (0.2-0.3%+ per trade). The cumulative profit allows you to stay in the green long-term, neutralizing drawdowns.

ATR Engine · Liquidity Window

One Chart. One Algorithm. No Noise.

99% of systems pile on indicators to predict the unpredictable. Cryptanov does the opposite — strip everything down to pure price structure and measure only what is mathematically real.

What 99% of Systems Use

Dozens of indicators. One opinion. Zero statistical edge.

RSI / MACD / Stochastic
Bollinger Bands & EMA clouds
News feeds & sentiment scoring
Elliott Waves & pattern recognition
Macro calendar & event-driven entries

None of these predict the future. They describe the past — with delay.

PURE MATH

Cryptanov Engine

The signal is a mathematical statement, not a prediction.

Liquidity Window Algorithm — identifies the exact zones where stop-hunts and liquidation cascades statistically cluster
Smart ATR Engine — measures the true average volatility range per coin and timeframe, dynamically recalibrated
Raw price structure only — no lagging indicators, no human interpretation, no curve-fitting
ATR Volatility Band — the only thing the algorithm reads
Risk-Reward Architecture

Symmetric vs Asymmetric Risk-Reward

The classic 1:3 RR rule looks perfect on paper. In a live, leveraged market it often works against you. Two validated models solve this from opposite angles.

Why Classic 1:3 RR Fails Small Accounts

Waiting for a 3× take-profit in a volatile market means your stop gets triggered first — statistically, more often than not. The wider your target, the lower your win rate. Lower win rate with leverage is a slow death spiral. Large funds can hold for months. A $500 account at ×10 leverage cannot. Cryptanov offers two architectures that work within real-world constraints.

Take > stop · results unstable

D1–D3 — symmetric models (experimental)

  • ATR-calibrated entry: stop is placed at the statistical edge of normal volatility — where price statistically does not go
  • Take-profit always larger than stop-loss — positive Expected Value per trade by design
  • Occasionally catches large momentum moves (+15–30%) when market aligns
  • A short stop allows higher leverage, but market noise hits it more often

Catches rare large moves, but because of short stops and long waits results are not yet stable. Kept in the forward test for observation.

Working zone 4–8% · tested on 5 years

ATR levels — asymmetric model (core)

  • Position breathes through normal volatility — no premature exits on market noise
  • In roughly two cases out of three price returns after a temporary pullback
  • Exchange-side stop on every position; liquidation lies beyond the stop
  • High frequency of small wins, rare but meaningful losses — net positive EV over time

The deeper the level, the higher the expected value after fees. The core of our own trading module.

ATR Level Strategies (Asymmetric)

The working levels are 4–8%: the deeper the level, the higher the expected value after fees. Shallow levels of 0.5–2% are near zero before fees and negative after — better not to trade them.

The Truth About Stop-Losses

Why stops only lock in losses and cut profits

  • A stop-loss is a tool for locking in losses. Any stop — whether 1%, 2%, 3%, 4%, or 5% — simply cuts your position at a loss. A stop doesn't protect from losses — it guarantees them.

  • For asymmetric strategies (ATR levels) the 5-year historical check showed that an 8% stop on the exchange with ×10 leverage beats tight stops — a tight stop knocks out trades that would have recovered. In the symmetric Strategy D1 the stop is placed by levels and the take-profit is always larger than the stop.

  • This is why the best potential lies in asymmetric strategies (ATR levels) on deep pullbacks: about 65–70% win rate and positive expectancy after fees. Look at expectancy, not just win rate.

  • Conclusion: don't use tight stops — they only cut profits. Look at asymmetric strategies with the highest EV potential.

Example: Strategy D3 is a symmetric strategy expecting greater profit than stop. Take-profit > stop-loss. However, when you expect larger profits, stops trigger more frequently, even with considerable stop-take distances. The strategy produces "small" losses but compensates with large gains. This is simply an example of how asymmetry works.

Live crypto signals — with open statistics and real-time verification

Crypto trading signals are hints about when to buy or sell a coin. There are hundreds of signal channels, but most of them share one problem: you cannot check the results. They show lucky screenshots, while losing trades quietly disappear. We did the opposite: every CAFE signal is recorded the moment it appears and stays in the statistics forever — both the winners and the losers.

How CAFE crypto trading signals work

CAFE (Crypto ATR Fractal Engine) does not try to guess where the market will go. The system finds the moments when the market changes phase — fractals — and measures how far price usually pulls back after them. This gives the pullback levels: 0.5%, 1%, 2% and deeper — up to 15%.

In practice it looks like this:

  • A buy signal appears when price pulls back to the calculated level.
  • The exit comes when price returns to the reference point or the move zone ends.
  • Four timeframes at once: 27 minutes, 50 minutes, 2 hours and 4 hours — from frequent short trades to rare and strong ones.
  • 34 major Binance coins: BTC, ETH, SOL, XRP and other liquid assets.

Thanks to this, the same logic works in both calm and sharp markets — only the depth that price reaches changes.

Why the depth of the level matters

On shallow levels the price move is small, while the exchange fee stays the same — so shallow signals often end up near zero over time. Deep pullbacks happen less often, but the reversal after them is stronger. In the forward test from June to November 2026, deep levels (4% and deeper) were profitable every single month — about +0.7% per trade on average after fees.

How many signals per day

It depends on the market. On the 4-hour fractal a calm day brings 150–200 signals across all levels, a day with a strong move brings 400–500 or more. Deep signals (4% and deeper) are much rarer: a quiet day may have none at all, while a crash day can have more than a hundred.

What this means for trading:

  • Calm market — many shallow signals and almost no deep ones. This is normal: the system does not go deep "just in case".
  • Sharp drop — price reaches the deep levels, and that is where the strongest signals appear.
  • Profit comes in bursts. In five-year tests, roughly the seven best days of the year produced half of the annual result — so it matters not to miss signals on such days.

That is why signals are best judged over a month or more, not by one lucky or unlucky day.

How to read the statistics on this page

Above on this page you see live statistics for all strategies and levels.

A few hints so you don't get lost:

  • Win Rate — the share of trades closed in profit. An important number, but not the main one: you can close 77% of trades in profit and still end at zero because of fees.
  • Average result per trade (EV) — the key metric. It shows how much one trade brings on average, already after fees.
  • PnL for a period — the sum of the results of all trades. It is not the return on a deposit but the sum of moves across signals.
  • ATR levels 0.5%…15% — switch between them to see how the result changes with pullback depth.

If in doubt, look at the average result per trade: it is what shows the real edge of a strategy.

How CAFE differs from typical signal channels

There are many crypto signals Telegram channels, but most of them cannot be verified.

Here is what makes CAFE different:

  • No manual forecasts. Signals are calculated by an algorithm from market structure — no "I think bitcoin will go up".
  • No cherry-picked screenshots. The whole history is open: by day, coin and level.
  • Honest math. Results are shown after exchange fees, not "on paper".
  • Bad days are not hidden. Days when the market falls and shallow levels go negative are visible just like the good ones.
  • Checked against a real exchange. We regularly compare calculated results with actual trades on Binance.

That is why CAFE statistics can be trusted: they cannot be edited afterwards or reduced to the good days only.

How we verify signals

Trust in signals is built on a clear procedure, not on words. It is the same for every coin and every level.

Every signal goes through the same verification rules:

  • Forward test, not a backtest. A signal is recorded before the outcome — it cannot be adjusted afterwards.
  • Results after fees. All percentages on the site already include the exchange fee.
  • Five years of history. We checked the level logic on 2021–2026 data for all 34 coins, including years the model had never seen.

This way the statistics on the site show the real picture — together with losing trades and bad days.

Example: how one signal works

Imagine a coin that rose for several hours and then began to pull back. The CAFE algorithm marks the phase change point — the top of the rise — and already knows how far this coin usually pulls back after such tops.

Then everything happens step by step:

  1. Price pulled back 4% from the top — a buy signal with the 4% level appears on the site and in the channel.
  2. Then there are two scenarios. Most often, after a deep pullback, price bounces and returns to the reference point — the trade closes in profit. Sometimes the drop continues — then the trade closes at a loss when the move zone ends.
  3. The result is recorded in the statistics right away, after fees — whether it is a profit or a loss.

A single trade can lose — that is normal. The edge of CAFE crypto signals shows over hundreds of trades: on deep levels a bounce happens noticeably more often than a continued fall.

Who the signals are for and what the risks are

Crypto trading signals suit those who want to trade by rules rather than emotions: beginners who need a clear entry point, and experienced traders who want statistics by level.

At the same time, keep the risks in mind:

  • Signals do not remove risk. The crypto market is volatile: on crash days price can move 10% or even 20% within a few hours.
  • Position size matters more than accuracy. Spread your deposit across many trades and avoid high leverage — then one bad trade will not ruin a month.
  • Don't trade on emotions. A missed signal is not a reason to enter later at a worse price. The next signal will come.
  • Look at the long run. Judge results over a month or more, not by a single day.

If you follow these simple rules, you can use signals calmly, without unnecessary risk to your deposit.

Free and Premium

We want everyone to be able to check the signals first and only then decide whether to pay for them.

Access to the signals comes in two forms:

  • Free: signals of the 4-hour fractal — for the first 100 members of the CAFE channel. The first members keep free access even after the subscription launches.
  • Premium (from $9.99 per month): the 2-hour, 50-minute and 27-minute fractals. A trade on the 50-minute fractal lasts about an hour and a half on average — less time in the market, lower risk of being caught by a sharp move.

You can start for free and subscribe later — once you see the results yourself.

How to start receiving signals in Telegram

All signals arrive in the CAFE Telegram channel the moment they appear. You don't need to install any software.

You can start receiving crypto signals in a couple of minutes:

  1. Open the CAFE Telegram channel via the link on this page — crypto trading signals arrive there in real time.
  2. Look at the statistics by strategy and level above — they update live.
  3. Start with the deep levels and a small share of your deposit per trade.

After that the signals arrive by themselves — all that is left is to follow the rules and judge the result over time.

Frequently asked questions about crypto signals

We have collected answers to the questions we are asked most often.

Are there free crypto signals?

Yes: signals of the 4-hour fractal are free for the first 100 members of the channel. The other fractals are available by subscription from $9.99 per month.

Where do the signals come from?

They are calculated by the CAFE algorithm from market structure: phase change points and pullback statistics for each coin. There are no manual "forecasts".

Can I check the results?

Yes. Every signal is recorded when it appears, and the statistics are open on the site: by day, coin and level, after fees.

Are the signals for futures or spot?

The signals are calculated on Binance futures, but the pullback-to-level logic also works on spot — without leverage.

How much money do I need to start?

You can start with a small amount. The main thing is not to put a large share of your deposit into one trade: there are many signals, and risk is better spread across them.

Does this guarantee profit?

No. There are losing days and weeks — we do not hide them. Signals are a statistical edge over time, not a guarantee. Not investment advice.

If your question is not here, ask it in our Telegram channel.